Fix- VSCode is not showing DevTools for flutter development
December 09, 2021
VSCode is not showing DevTools for flutter:
If you are using VSCode to develop Flutter app, you can use DevTools to get more advanced options. DevTools is a set of tools that provides different performance and debugging tools. Using DevTools, you can do:
- Inspection of UI layout and state of a Flutter application
- Diagnose UI related issues
- CPU profiling of a Flutter application
- Network profiling of a Flutter application
- Source-level debugging
- Memory issue debugging
- Log inspection
- Code and app size analysis etc.
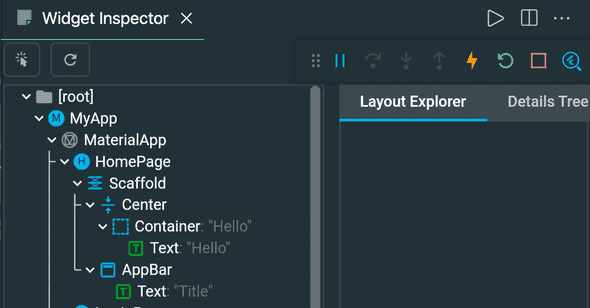
For example, you can use layout inspector to inspect the UI elements for debugging:
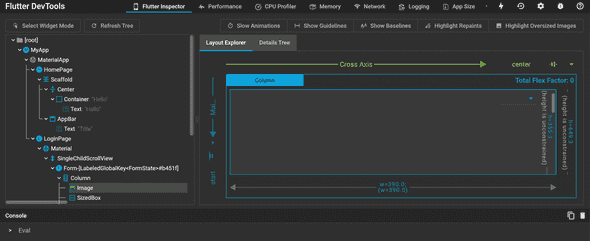
The above inspector is running inside VSCode. You can also use DevTools in browsers:
But, if you don’t see the option to start DevTools, you can follow this guide.
Let me show you how to enable that.
Make sure to install the Dart and Flutter extensions:
If you haven’t, install the Dart and Flutter extensions. Without these extensions, DevTools can’t be enabled.
Start the project in debugging mode:
You need to start the project in debugging mode. You can use Run > Start Debugging or F5 to start it in debugging mode.
If you not using debugging mode or if you are using flutter run to run the project. It shows the browser address in the console.
You can open the link on any browser to open the devtool in browser.
Launch DevTool:
Once the app is running in debugging mode, you can open the DevTool window.
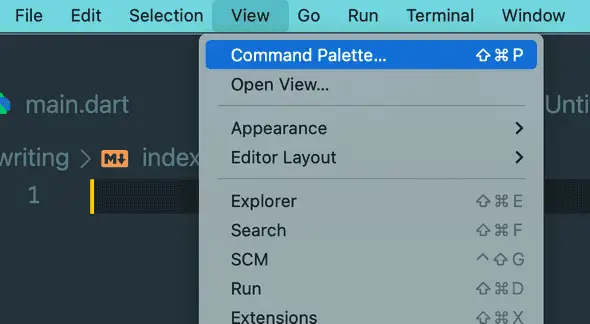
- First of all, open command palette. Click View and click on Command Palette to open the command palette.
- It will open the command palette. Here, search for devtool. It will show different commands for DevTool.
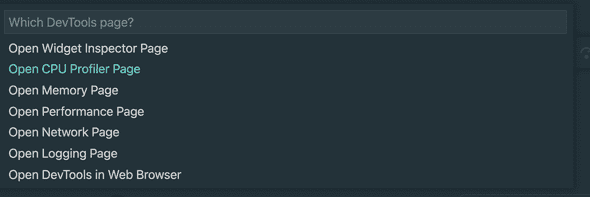
- From these options, click on Open DevTool. It will show another list of different DevTools options.
You have the option to select from this list:
- Widget inspector
- CPU profiler
- Memory page
- Performance page
- Network page
- Logging page
- DevTools in web browser
If you select DevTools in web browser, it will open the DevTool in a browser window. You can select different types of tools in the browser window.
If you select any of the other options, it will open the DevTool inside VSCode.
If you haven’t used DevTool before, it will show one message as like below:

You can choose Open or Always Open.


